1
2
3
4
5
6
7
8
9
10
11
12
13
14
15
16
17
18
19
20
21
22
23
24
25
26
27
28
29
30
31
32
33
34
35
36
37
38
39
40
41
42
43
44
45
46
47
48
49
50
51
52
53
54
55
56
57
58
59
60
61
62
63
64
65
66
67
68
69
70
71
72
73
74
75
76
77
78
79
80
81
82
83
84
85
86
87
88
89
90
91
92
93
| #include "plotlines.h"
PlotLines::PlotLines(QWidget *parent) :
QwtPlot(parent)
{
setTitle("图的标题");
QwtPlotCanvas *canvas=new QwtPlotCanvas();
canvas->setPalette(Qt::white);
canvas->setBorderRadius(10);
setCanvas( canvas );
plotLayout()->setAlignCanvasToScales( true );
setAxisTitle( QwtPlot::yLeft, "ylabel" );
setAxisTitle( QwtPlot::xBottom, "xlabel" );
setAxisScale(QwtPlot::yLeft,0.0,10.0);
setAxisScale(QwtPlot::xBottom,0.0,10.0);
QwtPlotGrid *grid = new QwtPlotGrid;
grid->enableX( true );
grid->enableY( true );
grid->setMajorPen( Qt::black, 0, Qt::DotLine );
grid->attach( this );
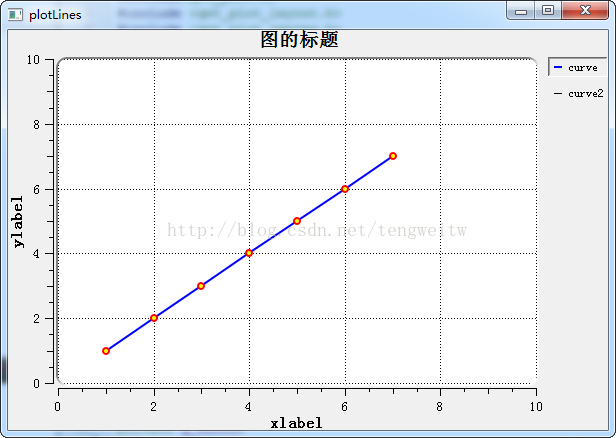
QwtPlotCurve *curve=new QwtPlotCurve("curve");
curve->setPen(Qt::blue,2);
curve->setRenderHint(QwtPlotItem::RenderAntialiased,true);
QwtSymbol *symbol = new QwtSymbol( QwtSymbol::Ellipse,
QBrush( Qt::yellow ), QPen( Qt::red, 2 ), QSize( 6, 6) );
curve->setSymbol( symbol );
QPolygonF points1, points2;
points1<<QPointF(1,1)<<QPointF(2,2)<<QPointF(3,3)<<QPointF(4,4)<<QPointF(5,5)<<QPointF(6,6)<<QPointF(7,7);
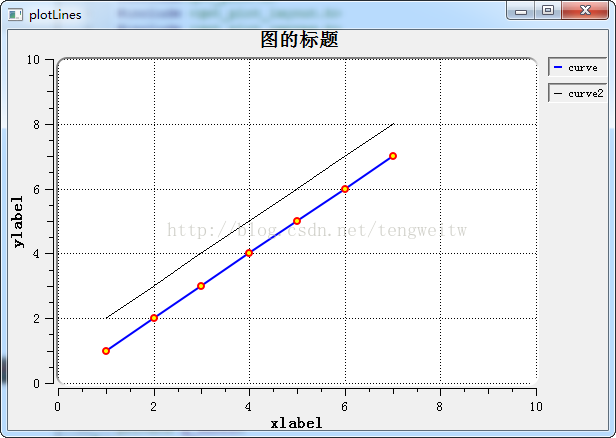
points2<<QPointF(1,2)<<QPointF(2,3)<<QPointF(3,4)<<QPointF(4,5)<<QPointF(5,6)<<QPointF(6,7)<<QPointF(7,8);
curve->setSamples(points1);
curve->attach( this );
curve->setLegendAttribute(curve->LegendShowLine);
QwtPlotCurve *curve2=new QwtPlotCurve("curve2");
curve2->setSamples(points2);
curve2->attach( this );
curve2->setLegendAttribute(curve->LegendShowLine);
QwtLegend *legend = new QwtLegend;
legend->setDefaultItemMode( QwtLegendData::Checkable );
insertLegend( legend, QwtPlot::RightLegend );
connect( legend, SIGNAL( checked( const QVariant &, bool, int ) ),
SLOT( showItem( const QVariant &, bool ) ) );
QwtPlotItemList items = itemList( QwtPlotItem::Rtti_PlotCurve );
for ( int i = 0; i < items.size(); i++ )
{
if ( i == 0 )
{
const QVariant itemInfo = itemToInfo( items[i] );
QwtLegendLabel *legendLabel =
qobject_cast<QwtLegendLabel *>( legend->legendWidget( itemInfo ) );
if ( legendLabel )
legendLabel->setChecked( true );
items[i]->setVisible( true );
}
else
{
items[i]->setVisible( false );
}
}
this->resize(600,400);
this->replot();
setAutoReplot( true );
}
void PlotLines::showItem(const QVariant &itemInfo, bool on)
{
QwtPlotItem *plotItem = infoToItem( itemInfo );
if ( plotItem )
plotItem->setVisible( on );
}
|


